Why Your Match List Should Be Shorter: How We Remove False DNA Matches
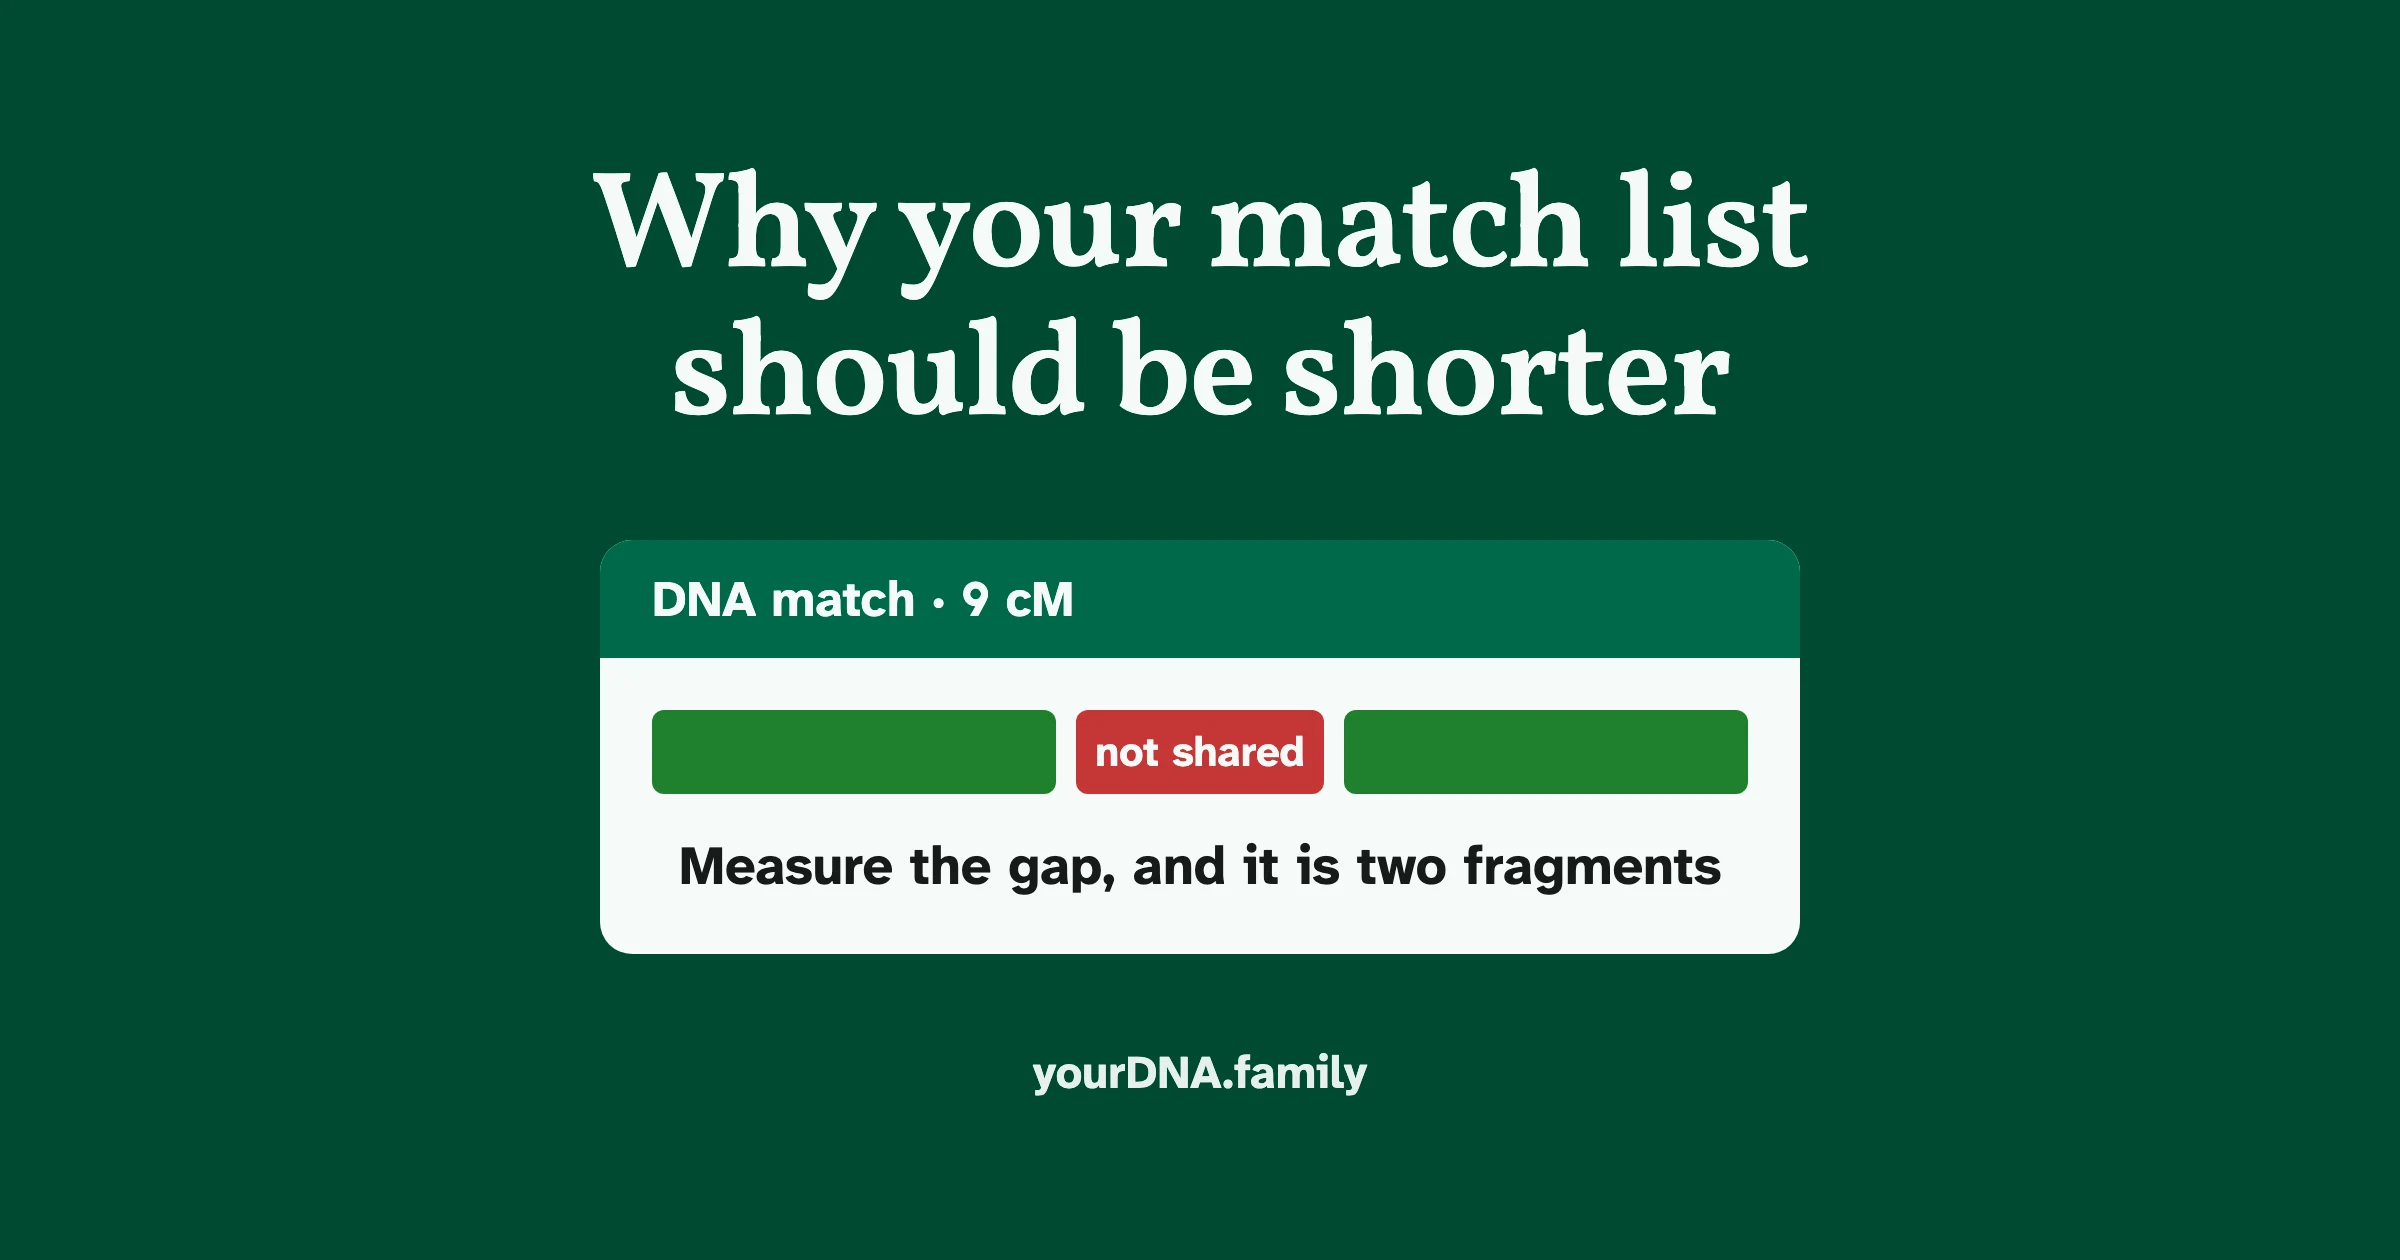
Showing you more matches is easy. Being right about them is the hard part.
A DNA match is a claim, and it is a specific one: you and this person inherited this stretch of chromosome from the same ancestor. There are two well-understood ways for that claim to be false, and they are different enough that they need different tools. This article explains both, and gives the measured numbers for what each one removes from a match list.
A note on where the numbers come from. We recently ran every possible pairwise comparison across our database, to calibrate our relationship-prediction model and to tune the throughput of the matching engine. That exercise produced a complete before-and-after picture of what our validation steps actually do, which is not something you often get to measure. It seemed too useful to keep to ourselves, so we are publishing it.
One piece of vocabulary before we start, because the rest of the article leans on it. A centimorgan (cM) measures genetic distance rather than physical length: a stretch of 1 cM has roughly a one percent chance of being broken by recombination in each generation. That is why size matters so much. A long shared stretch has not yet had time to be broken up, so it points to a recent common ancestor, and the shorter the stretch, the weaker that inference becomes.
The first way a match goes wrong: the side jump
You carry two copies of every chromosome, one from your mother and one from your father. A raw DNA file does not tell you which letter came from which parent. It tells you only that at a given position you have, say, an A and a G, without saying which side each came from.
So a matching program comparing two people can only ask a weaker question: does at least one of your letters match at least one of theirs, at each position? Answer that position by position and you can follow a run that begins along your mother's copy, drifts onto your father's copy partway through, and carries on to a respectable length. It is closely related to what geneticists call a haplotype switch error. We call it the side jump, because that is what it does.
On its own, each half is usually too short to mean anything. Stitched together, they look like a matching segment from a cousin.
A real segment stays on one side. A side jump does not.
Phasing: working out which parent gave you which letter
Phasing means working out, position by position, which of your two letters came from your mother and which from your father. Once that is known, the side jump stops being invisible.
If you and one of your parents have both uploaded a DNA kit, our system recognises the relationship from the DNA itself and phases you against them. There is no form to fill in and no setting to find.
As of August 2026, 21.5% of the DNA files uploaded to Your DNA Family are phased this way, so for roughly one file in five the parental picture already exists and is waiting to be used. The share is that high because many of our members have tested close family members, and we expect it to come down as we grow.
A phased candidate match can then be walked position by position to see which parental copy it actually sits on. A genuine one stays on a single side from beginning to end. One that changes sides is split at the crossing point, or dropped.
Phasing also lets us look further down. Without it we will not report a match below 8 cM, because beneath that we cannot reliably separate a real segment from a coincidence. With one parent phased we can go to 7 cM, and with both parents phased to 6 cM. That is a lower floor, and we permit it only where a stronger check exists: a phased segment can be checked against the parental picture rather than taken on trust.
Being straight about when phasing is actually used. Phasing is computed for every file it can be computed for, and nothing is charged for it. What decides whether that parental picture is then put to work on a comparison is a subscription, and it works from either side. A pair is walked against the picture, and held to 6 or 7 cM instead of 8, whenever either of the two people in it has one. Where neither person in a pair has one, that comparison is not walked against a parental picture and it stays at 8 cM. One limit we would rather state than have you discover: a subscription decides whether phasing is used, not whether it exists. Where no parent has tested on either side of a pair, there is nothing for us to walk against, and the 8 cM floor stands.
Where this stands today. You cannot start a subscription. There is nothing to buy at the moment, and no setting in the app that switches this on. It is on for a small number of accounts belonging to people who backed this work early, and we are not adding to that group at the moment. We have turned purchasing off while we move to a different payment provider, and we have not set a date for turning it back on. We would rather tell you that than describe something you would go looking for and not find. The parental picture is built wherever a parent has tested, and every gap is measured before two pieces are joined. Neither of those is charged for.
Here is what that looks like on a real candidate. On chromosome 7, one pair produced an 8.0 cM match across 1,089 compared markers. Both people had a parent tested, so the match could be walked against the parental picture position by position. There was no stretch anywhere along it, of any length, that stayed on one parent’s side. Not a short one, not a partial one: none. An 8.0 cM segment that clears every threshold we use, and it was never inherited from a shared ancestor at all.
An 8.0 cM match with no parental side to sit on
What phasing actually removes
This is the question genealogists ask and it is rarely answered with numbers, so here are ours. The table below counts one specific thing: candidate matches that phased validation rejected outright, because no consistent parental pairing survived anywhere along them. That is the cleanest reading of “this match is not real”, and it is the number worth publishing. Phased validation also trims the edges of many more segments, which is a different measurement and is deliberately not mixed into these rates.
Rejection rate falls away as segments get bigger
| Match size | Rejected | Segments examined* | 95% confidence interval |
|---|---|---|---|
| 6–7 cM | 16.0% | 162 | 11.2 – 22.5% |
| 7–8 cM | 7.7% | 287 | 5.1 – 11.3% |
| 8–9 cM | 2.1% | 234 | 0.9 – 4.9% |
| 9–10 cM | 1.4% | 219 | 0.5 – 4.0% |
| 10–15 cM | 0.6% | 970 | 0.3 – 1.3% |
| over 15 cM | none | 5,232 | 0 – 0.07% |
* Why the smaller sizes have fewer segments in them. That is a consequence of our own thresholds, not of how much data we hold. Every row here counts only comparisons where phased validation actually ran, which means both people have a parent tested. A 6–7 cM segment cannot appear in any other kind of comparison: without phasing the reporting threshold is 8 cM, and with one parent phased it is 7 cM, so a segment that small is never reported in the first place and never reaches this test. The bands are sized by who is eligible for the check, not by how many people are in the database.
One thing this table is not saying, and it matters more than the table itself. These are not the false-positive rates for segments of these sizes. The 16.0% in the top row does not mean that only 16% of 6–7 cM segments are false. Phased validation is the last filter a candidate meets, not the only one. Before it, a candidate has already had its gaps measured, its marker density checked and its length tested against the reporting threshold. These percentages are what is still standing after all of that and is still false, so the total share of small segments that never reach you is considerably higher.
A rejection rate is also not a confidence rate. Knowing that a filter removes 16.0% of what reaches it tells you the check discriminates; it does not tell you how far to trust the remainder. The honest answer on the remainder is the shape of this table: confidence climbs steeply with length, and it is at its weakest exactly where these thresholds sit. Treat a 6 cM segment as a reason to look, never as a reason to be sure.
The bottom row is worth a moment. Identical by state simply means two people read the same letters at a position. When that match is not inherited from a shared ancestor, identical by state but not by descent, it is a coincidence, and that is what phasing is hunting. It is a small-segment phenomenon. Above 15 cM, phased validation rejected nothing at all across 5,232 segments. The largest single segment it has ever rejected was 14.1 cM.
That agrees with the established expectation in the field. Durand, Eriksson and McLean examined nearly 3,000 mother–father–child trios and found false-positive segments climbing steeply as segments get smaller, while large segments are almost always genuine (Reducing Pervasive False-Positive Identical-by-Descent Segments Detected by Large-Scale Pedigree Analysis, Molecular Biology and Evolution 31(8), 2014). We did not tune our engine towards that expectation; we measured our own data and arrived at it independently.
If a parent has tested, we work the relationship out from the DNA itself and build the parental picture, with nothing for you to set up. Upload both files and the phasing is detected for you. It is free to use today.
The second way a match goes wrong: the glued gap
The second failure mode needs no parent, and the tool for it applies to everyone.
When two shared pieces sit close together on the same chromosome, joining them into one longer match is an obvious thing to want to do. But if that join is made without examining the space between them, the length of that space gets counted toward the total. Two fragments that were each too small to report become one match that comfortably clears the threshold.
So before we bridge a gap, we measure it.
At every position you carry one letter from each parent. Two people who genuinely share a stretch of DNA must therefore have at least one letter in common at every position inside it. If one person reads AA and the other reads GG, there is no letter in common and no way to inherit that from a shared ancestor. Geneticists call this an opposite homozygote (both people carrying a matched pair, but of different letters), and, barring the occasional testing error, it cannot occur inside genuinely shared DNA.
Test equipment does misread occasionally. We measured that floor on one real father-and-son pair in our own data, where every position must match: about one position in 600, or 0.16%. That is one representative pair rather than a universal constant, but it is the right order of magnitude and it is measured rather than assumed. So a single opposite homozygote proves nothing, and we never treat one as breaking a segment. What we act on is a cluster of them in a gap with enough readable positions to judge: at minimum two contradictions, and a gap dense enough to be worth measuring. Then we refuse the join.
Measure the gap, and one match becomes two fragments
Across the sweep, 38,365 gaps failed this test and were not bridged. Restricting to the ones with a solid basis for judgement, meaning at least 100 readable positions inside the gap, leaves 25,036, averaging 379 comparable positions each. These are dense, well-measured stretches of the genome, not empty ones where a verdict would be guesswork.
Refusing a join is not deleting DNA
This is the part most explanations get wrong, and it is worth being precise about.
When we refuse to bridge a gap, we do not throw away the DNA on either side of it. Those fragments are real. We simply stop treating them as one piece and report each on its own merit. If a fragment clears the reporting threshold by itself, it stays in your list. If nothing is left above the threshold once the gap stops being counted, the match goes.
Which means the same finding, a contradicted stretch inside a candidate, has two completely different outcomes depending on what sits either side of it. That is the whole mechanism, and it is easier to see than to describe.
The same contradicted gap, two different outcomes
Read that way the two figures stop looking odd. Nearly every segment that disappeared was being held together by DNA arguing against it. The small share of surviving segments that also contain a contradicted stretch are exactly the cases where the real DNA beside it was substantial enough to stand alone, so refusing the join cost the match nothing but its exaggeration.
What this does to your closest matches
No match of 100 cM or more disappeared. Not one. The largest match that vanished completely was 84.2 cM, and it is worth walking through, because that single example contains the whole argument.
It was reported as a single 84.2 cM relationship, and it was never one piece of DNA: it was ten separate segments, averaging a little over 8 cM each. Both people had a parent tested, so every candidate could be checked against the parental picture rather than taken on trust. Across this pair, 82 gaps were measured and refused as contradicted, 51.9 cM of proposed joins in total, and 39 candidate fragments failed to reach the 6 cM reporting threshold on their own. Nothing was left. The whole match went.
Every piece the 84.2 cM match was left with, against the line it had to clear
One case from the sweep shows the mechanism exactly, and it is worth looking at closely because it is the shape most likely to fool a careful researcher. On chromosome 15 of one pair, four pieces of genuinely shared DNA sit end to end with four contradicted gaps between them. Not one of those four pieces would ever have been reported on its own: the largest is 2.1 cM, far below any threshold we use. The joining is what would have created a reportable match. Bridge those gaps without measuring them and the run reads as one 12.2 cM segment, which clears the threshold comfortably and is the kind of match people build theories on.
A 12.2 cM segment that dissolves when the gaps are measured
That is the point worth taking away, and it is not a rare shape. Across the sweep, 125 continuous runs like this one would have cleared the 8 cM reporting threshold as a single segment if their gaps had been bridged unmeasured, while containing no genuine piece of 8 cM or more. The largest reads as 15.6 cM and its biggest real fragment is 5.2 cM. A long segment is not automatically a real one. Length is evidence only if the DNA is continuous underneath it, and the only way to know that is to measure the spaces rather than assume them.
Above the 100 cM line the picture is different, and it deserves precision rather than reassurance. Large matches were not all left alone. Where a large match is a composite, several segments that happen to add up, a contradicted gap inside one of them is removed exactly as it would be anywhere else, and the reported total comes down. What does not happen at that size is the match disappearing.
And the reason your closest relatives are genuinely not in question is mechanical rather than lucky. A parent, a child, a sibling or a grandparent shares long continuous runs of DNA with you, whole chromosomes at a time, with nothing to bridge and no side to jump to. There is simply nothing there for either tool to find. Above 1,000 cM, which is where every one of those relationships sits, nothing was removed beyond trimming at the margins, and no match at any size above 100 cM disappeared. The errors live in the distant, marginal match assembled from short fragments, precisely the range where being wrong costs a genealogist the most, because it is the range where trees get extended.
What to do with this on your next session
- Your closest relatives are not in question. No match of 100 cM or more disappeared, and above 1,000 cM, where parents, children, siblings and grandparents sit, nothing was removed beyond trimming at the margins.
- Your distant matches are fewer, and better. A 9 cM match that is not in your list may well have been two small fragments with a contradicted gap counted in between.
- If a parent has tested, the parental picture exists for your file. Where a comparison is walked against it, the reporting threshold drops to 7 or 6 cM and every segment is checked against that picture; where it is not, that comparison stays at 8 cM.
- Nothing here asks anything of you. No thresholds to set, no filters to learn, no settings page to find.
What we are not claiming
These figures are measured on our own database, through our own pipeline. It is a set with a lot of closely related people in it, which is unusual, and the rates above should be read as what our validation did to our data rather than as a universal constant. We are describing our own results and our own method; we make no claim about how anyone else's matching works.
Every figure above is stated with the precision the underlying measurement supports, and where an interval is wide we have printed the interval rather than the midpoint alone. That is the standard we hold our own numbers to, and it is the standard we would encourage you to hold anyone's to.
See it on your own matches. Upload the raw DNA file you already have from Ancestry, 23andMe or MyHeritage. If a parent has tested too, the phasing is detected and built for you, and every gap is measured before anything is joined. It is free to use today.
Upload your DNA and see your matches